Find Out What’s Driving Renter Decisions
The 2025 SatisFacts Biennial Online Renter Study reveals how renters search for apartments, what drives their decisions, and what causes them to stay or leave.
From the new Gen Z era of apartment renters to the evolving Boomers who rent by choice, from budget-conscious households to high earners, the data paints a clear picture: today’s renters demand transparency, authenticity, and ease of experience.
Here are 50 apartment renter statistics you need to know in 2025.
Apartment Search Trends
How renters find apartments is evolving. Listing sites and community websites are no longer the dominant forces they once were. Renters are experimenting with AI search tools, social forums, and map-based search.
- 65% use listing sites like Apartments.com or Zillow (down from 79% in 2011).
- Community websites attract 51.7%, a 26.8-point decline since 2011.
- New in 2025: 11.5% are using AI-powered search/chat tools, and 12.4% rely on social platforms like Reddit or Nextdoor.
- 41.4% search via local maps – showing location-first behavior (driven by Gen Z and Millenials).
- Referrals from friends or co-workers, while still important at 39.6%, have seen a long-term decline from 59.2% in 2011.
- Online ratings and reviews remain vital, used by 45.9% of renters in 2025, though this figure is slightly down from 54.9% in 2023.
- 17.2% rented their current apartment without visiting the community (down 6.3% since reaching its peak in 2023).
- An automated chatbot to answer questions ranks lowest in search importance at 2.62 out of 5.0.
- In contrast, transparent information on all fees ranks most important at 4.64 out of 5.0.
- Information on the community’s apartments, amenities, and location ranks #3 at 4.55 out of 5.0 – with Gen Z placing importance at 4.62 compared to Baby Boomers at 4.37.
Online Reviews: Renters Want Authenticity
Reviews still decide leases, but renters are skeptical. They want detailed, authentic feedback and quick, personalized responses from management.
- Online ratings and feedback/comments from customers remain the #1 most trusted source (since 2019) at 75.3%.
- 82.3% (the highest since 2017) researched their current community’s online ratings and reviews before contacting the community – with 70% using them as a contributing factor in their decision.
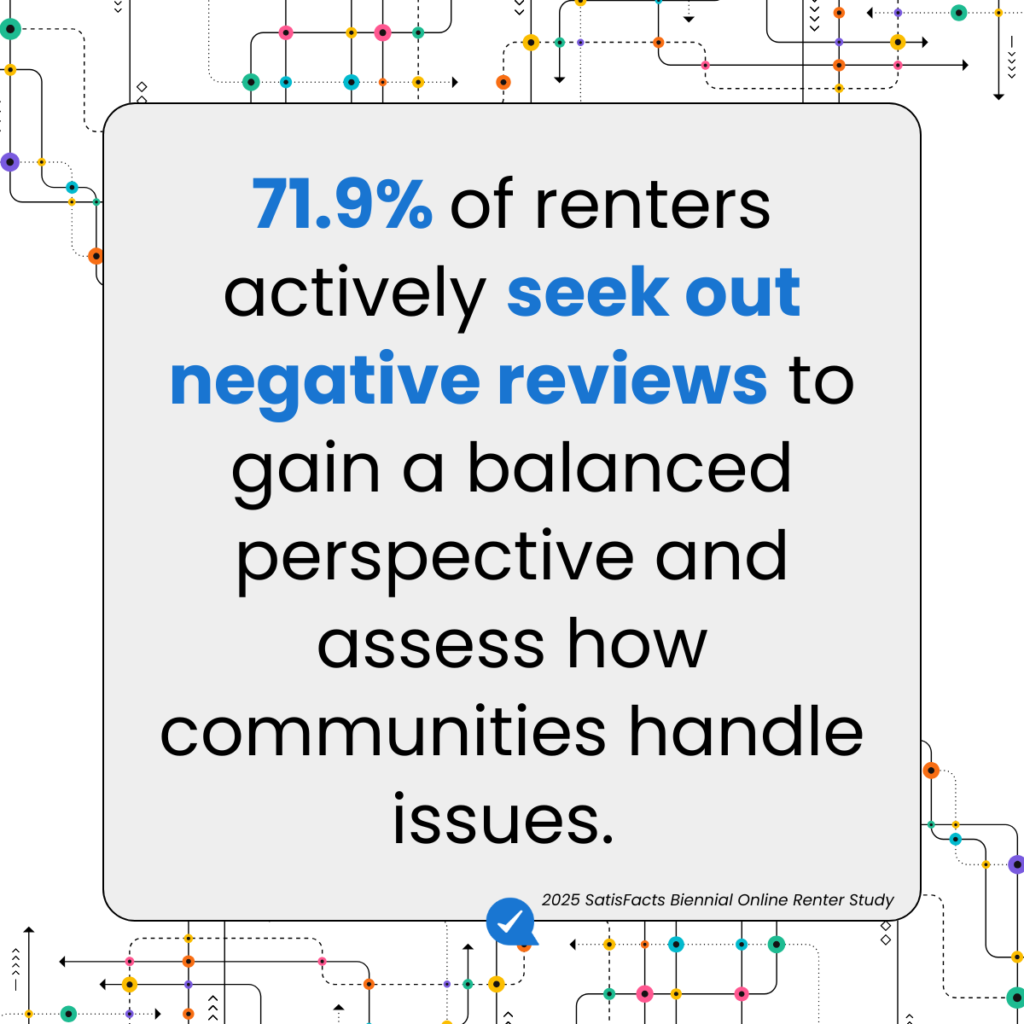
- 71.9% actively filter for and read negative reviews when researching their potential apartment communities (up 1.9 points from 2023).
- Renter perception averages a 4.39 out of 5.0 when managers address specific topics in replies vs just 2.52 (templated response) and 2.2 out of 5.0 (AI-generated response).
- 72.7% of renters would write a positive review if asked (up 9 points from 2023), yet only 30% say that they’ve been asked.
- 56.4% leave a negative review due to unexpected fees or poor communication on price increases.
- 63.3% of residents expect a response to their review within 2 business days or less.
- While only 10.7% of renters say they have written a review that was never posted, 61.4% of them believe it was due to deceptive review practices (ie review gating/filtering).
The Generation Gap:
- 70.5% of Gen Z (18-24) renters are confident they can recognize fake reviews vs. only 43% of Baby Boomers (60-79).
- Similarly, 83.9% of Gen Z believe they can spot a canned/automated review response, vs. only 55.5% of Baby Boomers.
Multifamily Brand Perceptions
Brand matters more than ever — but often as a risk, not a magnet.
- Only 21–24% have ever chosen a community due to brand name (2015–2023).
- In 2025, 35.4% avoided a community due to the company’s brand perception.
- The consideration of a company’s brand in choosing not to rent at a community is highest in the Mountain region at 49% and lowest in West South Central at 32%.
- High-rent renters ($3,000–$3,999) are the most brand-sensitive at 41.9% as compared to 30.9% of renters spending less than $1,000 on rent.
- 91.5% won’t rent from companies that mistreat their employees, community, or the environment (ESG).
- 78% of renters hold a positive or neutral sentiment regarding reporting rent to credit bureaus, while only 8.5% view it negatively.
- Even at a ≤$1,000 rent, 72.5% of renters feel positive or neutral about rent reporting to credit bureaus, yet 41%% were not informed before moving in.
- 83.3% want fee transparency — the #1 demand.
- 64.8% want transparency in utility billing and usage charges (ranked #3 across all generations).
- Among renters spending $3,000–$3,999, 86.8% still prioritize transparency on all mandatory fees.
Apartment Technology: No Longer a Differentiator
Tech is expected, not a bonus. Renters want the basics, including online payments, renewals, and smart access, however; the perceived importance of technology overall has dipped.
- The importance of technology to enhance communication, service and the resident experience fell from 4.24 (2021) to 3.81 (2025).
- Online rent payments rank #1 (valued by 85.2%).
- Online lease renewals and electronic lease signings rank #2 and #3 (78.3% and 77.5%).
- A surprising breakout: Package delivery notifications and lockers come in at #4 with 70.3% valuing their usage as a technology feature.
- 60.1% value keyless entry and smart access control.
- Least useful: only 15.9% value 24/7 AI chat support.
Know Your Demographics
- Technology features like community announcements and an online events calendar rank higher for the Silent Gen (#5 and #7) and Baby Boomers (#8 and #9) thank Gen Z (#12 and #13).
- Flexible rent and rewards programs rank higher for renters paying ≤$1,499 (#5 and #6) vs. renters paying $3,000+ (#11 and #12)
Meet Renters Where They Are
- Text messaging is the #1 preferred communication across all generations (68-76)%.
- Alternatively, website/community portal messaging ranks lowest (8.4-12.8%) across generations.
Renting as a Lifestyle Choice vs. Circumstance
The “rent by choice” segment is growing, but it varies by generation and rent tier.
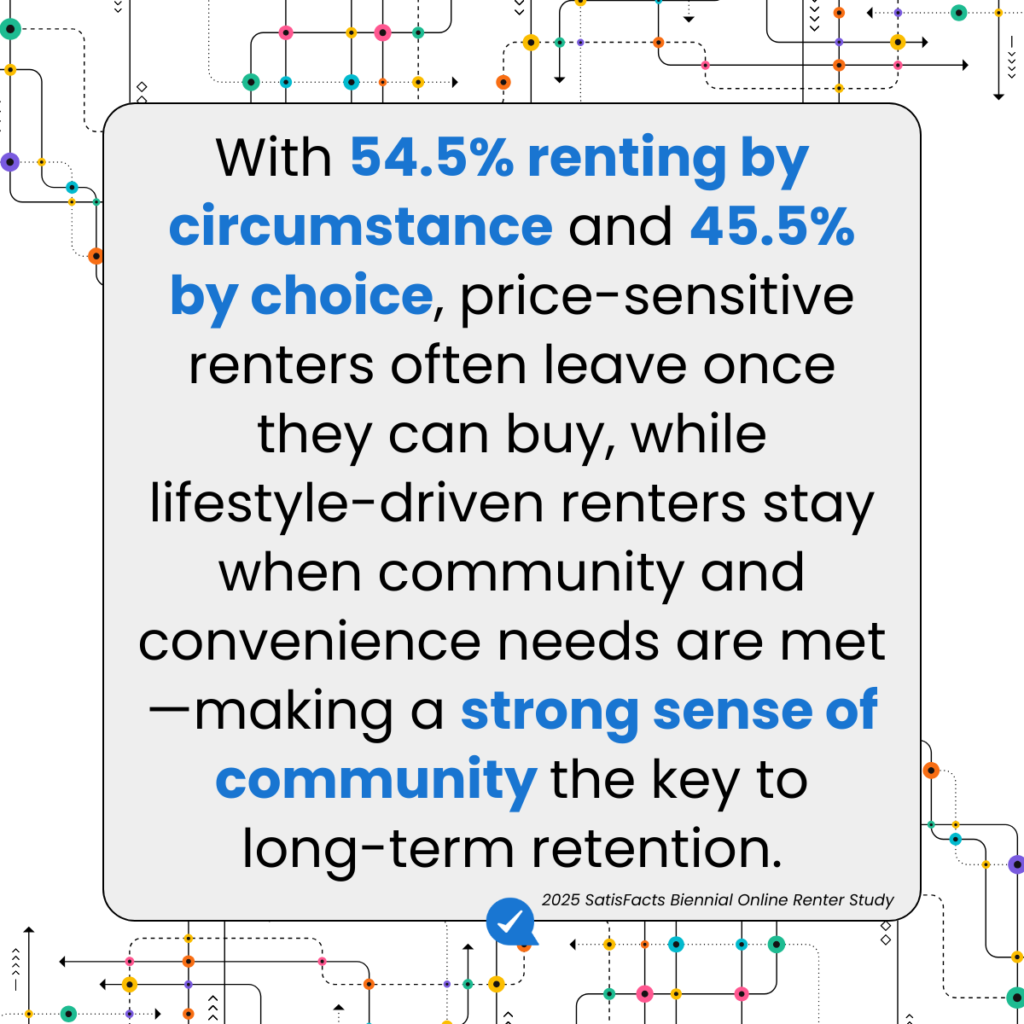
- 54.5% rent by circumstance; 45.5% rent by choice.
- The top reason for circumstantial renting: 43.1% say they can’t afford/qualify for a mortgage/home.
The Generation Gap:
- Only 39.4% of Gen Z rents by choice; 60.6% rent because homeownership is too risky or uncertain or because they cannot afford to buy a home.
- Alternatively, 65.5% of Baby Boomers rent by choice and 79% of the Silent Generation rent by choice.
- 73% of Boomers plan to rent for 3+ years, with 58.5% of that as 5+ years.
- Conversely, 53.6% of Gen Z plan to rent for 3+ years, with only 15% of that as 5+ years.
The Income Gap:
- 60.4% of renters paying <$1,000 rent by circumstance vs. only 42.8% of renters paying $4,000+.
- 44.8% of renters paying <$1,000 plan to rent for 5+ years compared to only 21.1% of those paying $4,000+.
Sense of Community Tied to Lease Length
Sense of community matters – especially for those renting by choice and for lower-rent tiers.
- For Baby Boomers and Silent Gen (more likely to rent by choice), the importance of sense of community ranks 3.81 out of 5.0.
- Similarly, renters paying ≤$1,000 value sense of community at 3.81 out of 5. While many don’t rent by choice, it’s clear that rental length raises the value of sense of community.
What This Means for Multifamily Leaders
The 2025 renter is savvy, skeptical, and segmented. To stay competitive, multifamily professionals should:
- Practice radical transparency — publish fees, billing, and pricing clearly.
- Build authentic reputations — respond to reviews with empathy and specificity.
- Perfect the basics in technology — seamless payments, renewals, and communication.
- Position renting as a lifestyle — especially for older demographics and higher-rent tiers.
Renters span generations, budgets, and regions, but they’re unified in one demand: honesty and ease. Communities that deliver both will win in 2025 and beyond.